
DEMYSTIFYING FINANCIAL RATIOS FOR ENHANCED INVESTMENT DECISIONS
- Wed Sep 25 18:30:00 UTC 2024
- In Mentoring and Guidance by Aparna Bose
In recent years, there has been a notable surge in the involvement of retail investors in the stock market. This increasing participation is particularly striking given the current climate of heightened volatility in equity markets. As stock prices fluctuate more dramatically, it becomes increasingly important for these investors to equip themselves with the knowledge of financial metrics that can guide their investment decisions.
Understanding various financial ratios is essential for retail investors as these ratios provide critical insights into a company's performance and financial health and serve as valuable tools for evaluating potential investment opportunities. By analyzing these ratios, investors can gain a clearer picture of a company's profitability, efficiency, and risk levels.
The common financial ratios every business should track are 1) liquidity ratios 2) leverage ratios 3) efficiency ratio 4) profitability ratios and 5) market value ratios. Here is a concise overview of key ratios organized into five main categories:
1. LIQUIDITY RATIOS
The liquidity ratio measures the company's capability to pay off liabilities due in the near term. This ratio reflects whether an individual or business can pay off short-term dues without any external financial assistance
A liquidity ratio above 1 indicates that the company possesses sufficient assets to meet its short-term debts, reflecting a strong financial position. A higher liquidity ratio suggests greater financial stability and a lower risk of insolvency.
Liquidity ratio is a vital tool for gauging financial resilience, highlighting the company's capacity to manage short-term commitments effectively. Discussed below are a few types of liquidity ratios:
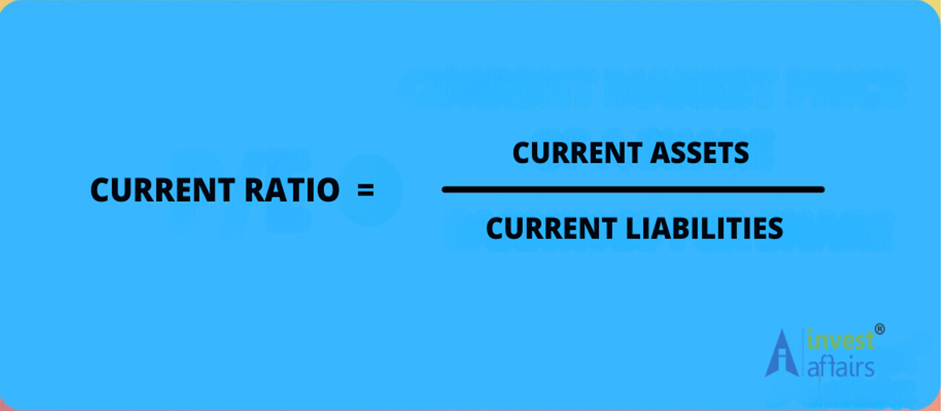
CURRENT RATIO
The current ratio implies the financial capacity of a company to clear off its current obligations by using its current assets.
Here the current assets include cash, stock, receivables, prepaid expenditures, marketable securities, deposits, etc. Current debts include short-term loans, payroll liabilities, outstanding expenses, creditors, various other payables, etc.
A current ratio under 1 suggests poor financial performance for a business or individual. It indicates an inability to cover current financial obligations with available assets.
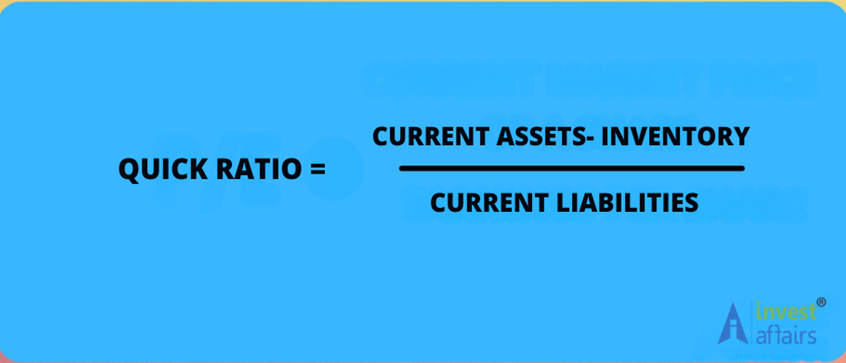
QUICK RATIO
The quick ratio, also known as the acid-test ratio, is a financial metric used to assess a company's short-term liquidity. It measures a company's ability to meet its short-term obligations without relying on the sale of inventory. The quick ratio is considered a more stringent measure than the current ratio, as it excludes inventory from current assets.
Quick Ratio can be calculated in two manners:
a) Quick Ratio = (Marketable Securities + Available Cash and/or Equivalent of Cash + Accounts Receivable) / Current Liabilities
b) Quick Ratio = (Current Assets – Inventory) / Current Liabilities
The components being:
- Current Assets: Assets that are expected to be converted into cash within one year, including cash, cash equivalents, accounts receivable, and inventory.
- Inventory: Goods available for sale. Since inventory may not be quickly convertible to cash, it is excluded from this calculation.
- Current Liabilities: Obligations that the company needs to settle within one year, including accounts payable, short-term debt, and other liabilities.
INTERPRETATION
- Quick Ratio > 1: Indicates that the company has more liquid assets than current liabilities, suggesting a strong ability to meet short-term obligations.
- Quick Ratio < 1: Indicates that the company's current liabilities exceed its liquid assets, which may raise concerns about its short-term financial health.
- Quick Ratio = 1: Suggests that the company can exactly cover its current liabilities with its liquid assets.
Nevertheless a 1:1 quick ratio is ideal and reflects the stable financial position of a company.
2. LEVERAGE RATIOS
A leverage ratio is a financial metric that measures a company's debt in relation to its assets or equity. It is used to assess a company's financial health, particularly its ability to meet its debt obligations. A high leverage ratio can indicate that a company is riskier because it has a higher debt burden.
Some common leverage ratios include:
- Debt-to-equity ratio: Total debt divided by total equity
- Debt-to-assets ratio: Total debt divided by total assets
- Debt-to-capital ratio: Total debt divided by total debt plus total equity
A leverage ratio of 0.5 or less is considered ideal, meaning that no more than half of a company's assets are financed by debt. Let us understand and explore the various types of leverage ratios:
DEBT TO ASSET RATIO
A debt to asset ratio is a financial metric that shows how much of a company's assets are financed by debt. It's calculated by dividing a company's total liabilities by its total assets. The ratio is sometimes expressed as a percentage.
Here's how to calculate the debt to asset ratio:
Add up all short-term and long-term debt to get the total liabilities.
Divide the total liabilities by the total assets.
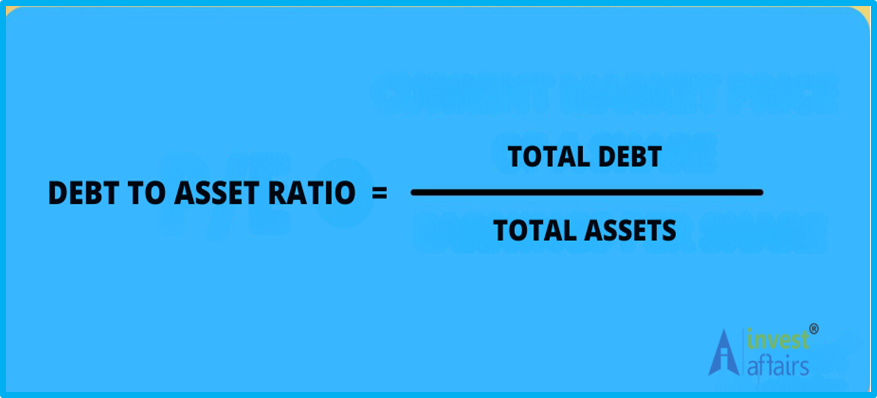
When the debt to assets ratio is 1, it signifies that the company has equal levels of assets and liabilities, indicating high leverage. If the ratio falls below 1, it suggests that the company's assets exceed its liabilities. This means that the company can cover its obligations by selling its assets, making it less risky. Conversely, if the debt to assets ratio exceeds 1, it shows that liabilities surpass assets. This situation can lead to potential bankruptcy and poses a significant risk for investors.
DEBT TO EQUITY RATIO (D/E)
The debt-to-equity ratio (D/E ratio) illustrates the amount of debt a company holds in relation to its assets. This ratio is determined by dividing the total debt of the company by its total shareholder equity. It's important to note that a higher D/E ratio may indicate that the company could face challenges in managing its liabilities.
Debt to Equity Ratio Interpretation:
Debt to equity ratio helps us in analyzing the financing strategy of a company. The ratio helps us to know if the company is using equity financing or debt financing to run its operations.
Debt to Equity Ratio Interpretation:
The Debt to Equity (DE) Ratio is a crucial indicator of a company's financing strategy, revealing the balance between equity financing and debt financing in its operations.
High DE Ratio
- Indicates High Risk: A high DE ratio signals that a company relies heavily on debt to fund operations.
- Possible Financial Strain: This reliance may indicate underlying financial difficulties or a lack of sufficient equity.
- Debt Financing Prevalence: A company with a high DE ratio is likely engaging more in debt financing, which can elevate risk for investors.
Low DE Ratio
- Indicates Financial Stability: A low DE ratio suggests that a company has ample shareholder equity and does not need to rely on debt.
- Greater Owned Capital: This scenario implies that the company possesses more owned capital (equity) than borrowed capital, demonstrating financial health.
- Positive Impression: A low DE ratio is generally perceived positively, indicating lower risk and potential stability for investors.

3.EFFICIENCY RATIOS
An efficiency ratio is a metric that measures how well a company uses its resources to generate income. It can be used to evaluate a company's operations, profitability, and financial health.
Efficiency Ratios:
- can help companies understand how they manage their costs.
- how they operate efficiently.
- can help companies determine their return on investment by comparing expenses to revenue.
- help companies make decisions about investments and creditworthiness.
- can be used to track and analyze the performance of commercial and investment banks.
Efficiency ratios can be calculated in different ways, depending on the area of operation being examined. For example, the accounts receivable turnover ratio is calculated by dividing net credit sales by the average accounts receivable. A higher receivables turnover ratio is generally considered positive, as it suggests that a company is collecting payments from customers quickly.
ASSET TURNOVER RATIO
The asset turnover ratio is a financial ratio that measures how efficiently a company uses its assets to generate revenue. It's calculated by dividing a company's net sales by its average total assets over a specific period.

A higher ratio is generally better, as it indicates that the company is more efficient at generating sales
RECEIVABLES TURNOVER RATIO
The accounts receivable turnover ratio is a simple metric that is used to measure how effective a business is at collecting debt and extending credit. It is calculated by dividing net credit sales by average accounts receivable. The higher the ratio, the better the business is at managing customer credit.
4.PROFITABILTY RATIOS
The profitability ratio shows how well a company makes money compared to its costs and expenses over a certain time. This ratio reflects the company’s overall performance. Profitability represents final performance of company i.e. how profitable company. It also represents how profitable owner’s funds have been utilized in the company.
RETURN ON ASSETS (RoA)
Return on assets (ROA) measures how efficient a company's management is in generating profit from their total assets on their balance sheet. ROA is shown as a percentage, and the higher the number, the more efficient a company's management is at managing its balance sheet to generate profits. A falling ROA indicates the company might have over-invested in assets that have failed to produce revenue growth, a sign the company may be trouble.

RETURN ON EQUITY (RoE)
ROE, or Return on Equity, is a way to see how well a company is doing. It shows how much profit the company makes compared to the money that shareholders have invested in it.
To calculate ROE, you need:
Net Income: This is the profit the company has made after expenses and taxes. Shareholders’ Equity: This is the total money that shareholders have put into the company, plus any profits that have been kept in the company instead of paid out as dividends.
Now divide the Net Income by Shareholders’ Equity. This calculation gives you a percentage that represents how effective the company is at using its investors' money to make profits. A higher ROE means the company is doing well at generating profits for its investors.
5.MARKET VALUE RATIOS
Market value ratios are financial metrics that help investors and business owners understand the financial performance of public companies. They are used to compare a company's stock price to other factors, including competitors' prices, to determine if a stock is overvalued, undervalued, or fairly valued.
Here are some examples of market value ratios:
PRICE -EARNINGS MULTIPLE OR RATIO (P/E)
The P/E Ratio, or Price to Earnings Ratio, is a way to measure how much investors are willing to pay for a company's earnings.
What do you need for calculating:
1.Current Share Price: This is how much one share of the company costs right now.
2.Earnings Per Share (EPS): This is how much profit the company makes for each share of stock, usually based on the last year.

A high P/E ratio indicates that a company may be overvalued or on a growth trajectory. It often signals expectations of future revenue increases, driving up current stock prices due to analyst and investor speculation. Conversely, a low P/E ratio suggests that a stock may be undervalued, potentially due to market risks. However, it may also reflect expectations of poor future performance, which could explain the current decline in stock prices.
PRICE-BOOK MULTIPLE (P/B)
The P/B (Price-to-Book) ratio establishes a relationship between a company's market capitalization and its asset value. This metric can be expressed as a per-share value by dividing the market value of outstanding shares by the total number of shares. Similarly, the net asset value is calculated by dividing the company’s total asset value by the number of shares in circulation. Value investors often utilize the P/B ratio, among other metrics, to assess whether a company's stock is overvalued or undervalued. This approach focuses on identifying stocks that trade below their intrinsic value, making the P/B ratio a crucial tool in the value investing toolkit.

Where:
Market Price per Share = Current market price of the share
Book Value per Share = (Total assets - intangible assets - total liabilities) ÷ number of outstanding shares
To determine the market value per share, you can refer to various stock tracking websites. Look for the company's balance sheet to find details on total assets, total liabilities, and outstanding shares. Typically, investment sites will provide this financial report under a "financials" tab, although some may feature it on the stock's summary page.
DIVIDEND YIELD
A dividend is a portion of a company's profits that it gives back to shareholders. Dividend yield is a way to understand how much money a company pays to its shareholders through dividends compared to the price of its stock.
Dividend yield is a financial metric that indicates how much a company pays out in dividends relative to its stock price. It's expressed as a percentage and is calculated using the following formula:

If a company has a high dividend yield, it means it pays out a lot of profit as dividends to shareholders. This can be attractive to investors looking for income.
Companies often compare their dividend yield to the average yield in their industry. This helps investors see how a company stacks up against its competitors.
Interpretation of Dividend Yield:
A higher dividend yield may indicate a good source of income for investors looking for cash flow, especially in comparison to other income-generating investments like bonds.
An unusually high dividend yield can sometimes suggest that a stock is undervalued or that the company is returning a significant portion of its earnings to shareholders. However, it may also indicate underlying issues, as the stock price may have dropped, causing the yield to spike.
Dividend yield can help investors assess a stock's suitability for their investment strategy. For those focused on income, such as retirees, a higher yield might be more appealing. Consistently paying and growing dividends can indicate a company's strong cash flow and stability, as well as management's commitment to returning value to shareholders.
Dividend yields can also reflect broader market conditions. In a low-interest-rate environment, for example, stocks with higher dividend yields may become more attractive compared to fixed-income investments.
In summary, dividend yield provides insights into the income potential of a stock and can be an important factor in investment decision-making, but it should be considered alongside other financial indicators.

However, these ratios should not be viewed in isolation; a holistic approach is essential when applying them. For example, a favorable price-to-book ratio does not automatically indicate that a company is a sound investment. Investors must also consider other factors, such as profitability and efficiency.
Furthermore, in a landscape characterized by unpredictable market movements, being well-versed in these financial indicators can empower retail investors to make informed choices rather than reactive decisions driven by market emotions. This knowledge not only enhances their ability to evaluate stocks more critically but also helps in building a robust investment strategy aimed at achieving long-term financial goals.
As retail investors navigate turbulent waters, understanding financial ratios is essential. We strongly recommend seeking professional guidance in building your wealth. Our experts at Investaffairs will happily guide you. Engaging with experienced finance professionals, particularly those skilled in mutual fund investments, can help you evaluate your risk tolerance and make more informed, prudent investment decisions.
Disclaimer: The data and information has been sourced from various domains available to the public. We have taken utmost care to represent the same as factually as has been made available. Please do not make any decisions based on our blogpost. Kindly check the data & information independently. For further guidance on finance and investment please reach out to our experts at Investaffairs.
If you have any Personal Finance query, do write to us
Categories
Recent Posts


